
A Case Study by PIP Realty Group | Real Estate Services: Delivered
Actual Sale Price:
$470,000
Projected Yearly
Income: $86,400
Projected Yearly Expenses: ($39,909)
Projected Yearly
NOI: $46,491
Forward Looking Statements Disclaimer: Certain statements that we make may constitute “forward-looking statements” under the Private Securities Litigation Reform Act of 1995. Forward-looking statements include information concerning future strategic objectives, business prospects, anticipated savings, financial results (including expenses, earnings, liquidity, cash flow and capital expenditures), industry or market conditions, demand for and pricing of our products, acquisitions and divestitures, anticipated results of litigation and regulatory developments or general economic conditions. In addition, words such as “believes,” “expects,” “anticipates,” “intends,” “plans,” “estimates,” “projects,” “forecasts,” and future or conditional verbs such as “will,” “may,” “could,” “should,” and “would,” as well as any other statement that necessarily depends on future events, are intended to identify forward-looking statements. Forward-looking statements are not guarantees, and they involve risks, uncertainties and assumptions. Although we make such statements based on assumptions that we believe to be reasonable, there can be no assurance that actual results will not differ materially from those expressed in the forward-looking statements. We caution investors not to rely unduly on any forward-looking statements and urge you to carefully consider the risks associated with purchasing real estate. We expressly disclaim any obligation to update any forward-looking statement in the event it later turns out to be inaccurate, whether as a result of new information, future events or otherwise.
Overview
Chicago commercial multifamily assets continue to be a top producing asset while maintaining low-volatility. This makes it attractive to seasoned and institutional investors as an ideal method to grow unit counts and maintain cash-flow. This case study takes a look at a singled out 8-unit building that PIP Realty Group brokered in early 2020.
As a category, multifamily buildings in Chicago make up 75% total housing stock in the city. This is not expected to rise significantly in the next decade, which will lead to steady demand and stable appreciation.
PIP Realty Group offers real estate investors access to cash-flow producing commercial-grade multifamily assets with built in property management. We are a group of Chicago natives who believe in building a better Chicago. Our model is to locate distressed housing assets in low and mid-income areas, invest in these properties, stabilize them with high-quality tenants and offer these tenanted-properties as cash-flowing assets to long-term hold orientated investors.
Our combination of expertise in residential development and management produce higher than average CAP rates, when compared to our national sister-cities. Let’s take a look at the numbers.
How Does It Perform?
Commercial multifamily rentals are a solid source of cash-flow. Outside of the turning cost in-between tenants, a multifamily rental is cost-efficient to own, especially after long-term capital improvements have been installed in the property. Long term CAPEX include; a new roof, copper-plumbing, circuit-breaker electric, new furnaces, and appropriately setting up the unit for individual utility meters.
| Projected Proforma, Income/Expense: | Monthly | Annual |
|---|---|---|
| Gross Potential Rent (estimated) | $7,200.00 | $86,400.00 |
| Total Income (estimated) | $7,200.00 | $86,400.00 |
| — Expenses — | — | — |
| Property Taxes – Tax Yr: 2018 | ($684.00) | ($8,209.00) |
| Insurance (estimated) | ($217.00) | ($2,600.00) |
| Property Management Fees (Pct of Gross Rent) | ($576.00) | ($6,912.00) |
| Allowance for Maintenance/Turnover/Vacancy (estimated Pct of Gross Rent) | ($1,080.00) | ($12,960.00) |
| Water/Sewer (estimated) | ($285.00) | ($3,420.00) |
| Trash Collection (estimated) | ($84.00) | ($1,008.00) |
| Common Area Utilities (estimated) | ($80.00) | ($960.00) |
| Common Area Maintenance (estimated) | ($320.00) | ($3,840.00) |
| Total Expenses (estimated) | ($3,326.00) | ($39,909.00) |
| —— | — | — |
| Net Operating Income (estimated) | $3,874.00 | $46,491.00 |
What Does the Single-Family Market Look Like in Chicago?
Multifamily buildings in Chicago make up the majority of the total housing stock. This is not expected to rise significantly in the next decade, which is predicted to supply steady demand and stable appreciation. The chart pictured below shows the median sale price of commercial multifamily buildings, like the one in this case study. This chart reveals how multifamily properties have faired throughout the last cycle, in the broader Chicagoland area and surrounding suburbs.
Compared to the national median sale price, small multifamily properties in Chicago are currently (Oct, 2020) trading at 6.35% higher than the national median. The national median sale price is ~$315,000 meanwhile, in Chicago, it is ~$335,000 for commercial multifamily buildings.

What Does the Rental Market Look Like in Chicago?
Rental pricing and vacancy has largely kept in pace with the national trends of: 1, low vacancy rates and 2, steadly increasing rents. As of October 2020 the Illinois rental price index has been hovering around 345 compared to the national average of 340. Illinois vacancy rates are historically low, hovering around 7.5% compared to the national average of 5.5%.
The important point these graphs illustrate is that Illinois rental units are attracting a slightly higher rent, compared to the national average and in-line with the national vacancy rate.
Illinois Rental Price Consumer Index & Vacancy Rates


How Do Chicago Housing Compare to Other Markets?
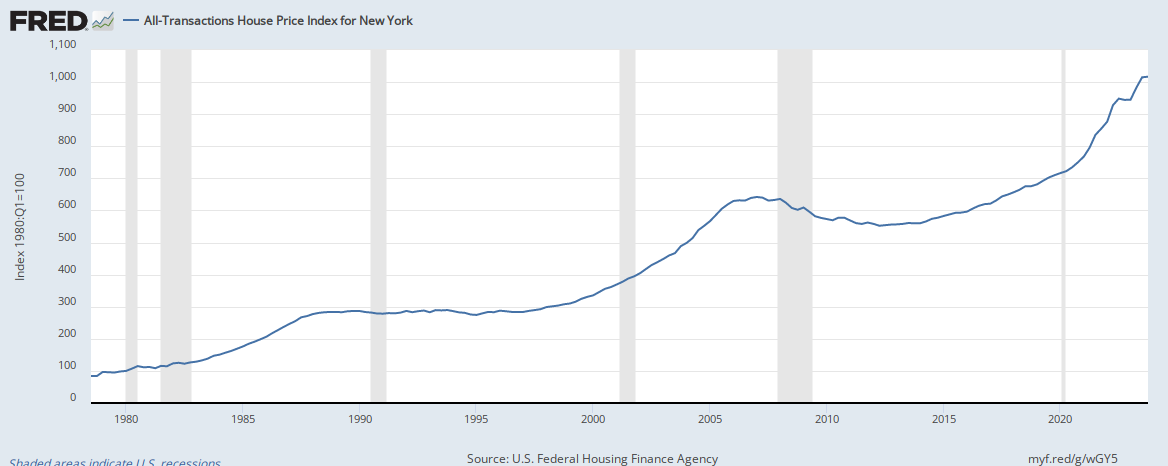
The Illinois housing index shows how the local housing price has been growing and evolving through-out the period that data is available. When compared to other large metro-suburban areas, both established and emerging, the Illinois housing price has a consistent history of stable and predictable growth.
Illinois housing pricing has largely kept pace with the growth of the state’s economy and pricing is not as volatile as other markets during times of economic uncertainty. Housing in Illinois is also significantly more affordable than similar metro-suburban areas in California, New York and Florida. When compared to an emerging housing market, like Texas, it looks like Illinois housing prices are stabilized where Texas is pushing towards a peak.
Illinois House Price Index


Concluding Insights
In conclusion, Illinois large-multifamily income properties provide stable cash-flow at higher than average returns when compared to national alternatives. Additionally, due to the stability of Illinois economy, largely made up of the Chicago metro-suburban area, property values are better shielded during times of uncertainty and economic volatility.
Thank you for taking the time to review this case study. To discuss this case study in more detail or to inquire about our investment services and inventory, send us a message.
Disclosure: All proforma financials are projections and estimates only. There are no implied or expressed guarantees of any cash flow projections contained in this document, on our website, or in any links provided. Real estate investments are subject to risk and loss of capital. All construction estimates are subject to change and contract with General Contractor. Any proforma numbers are projections based on historical and estimated data, but future performance cannot be guaranteed as markets and economies shift. It is recommended that buyers set aside reserves for potential vacancies and maintenance repairs. Rents, property taxes, insurance, loan rates, property management, maintenance and vacancy costs all vary depending on micro and macroeconomic factors. Buyers should perform their own due diligence in order to best forecast the potential performance of their rental properties. We recommend that buyers seek appropriate legal, tax & financial advice from suitably qualified professionals before taking any action.